Watching the Hudson Valley sky

Counting the
minutes the sky
flies low.

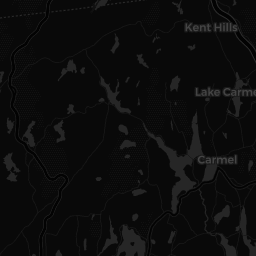
HVRA Tracker measures how often aircraft operate inside the KPOU Class D airspace below 2,700 ft MSL at Hudson Valley Regional Airport — turning live ADS-B signals into open, readable data about what's overhead.

0
Low minutes · today
0
Contacts · today
0
In envelope · now
SCOPE · KPOU CLASS D · 1090 MHz
© OpenStreetMap contributors © CARTO
Guided tour · 9 stops

Start here. We'll walk you
through the whole idea.

New to the project? Click through the stops — or use the arrows. Each one builds on the last, from the mission to the data.

STOP 01 / 09

What we watch

HVRA Tracker answers one simple question: how much low-flying air traffic passes over the area? Instead of vague impressions, it produces hard numbers anyone can check — for residents, researchers, and the curious alike.

Open data, not opinions
STOP 02 / 09

Class D surface area · 2,700 ft MSL

We track aircraft inside the KPOU Class D surface area, from the ground up to 2,700 ft MSL. An aircraft only counts while it's inside that airspace. Above the ceiling or outside the boundary, and it's ignored.

41.6265°N · 73.8842°W
2,700 FT MSLKPOUCLASS D SURFACE AREA
STOP 03 / 09

How aircraft announce themselves

Most aircraft broadcast their GPS position, altitude, speed and callsign about twice a second on 1090 MHz. That's ADS-B — Automatic Dependent Surveillance–Broadcast. Anyone with an antenna can listen; that's what makes this possible.

ADS-B · 1090 MHz · ~2 Hz
STOP 04 / 09

Reading the live map

Every contact appears with its callsign and altitude. Configurable distance rings — 0.25, 0.5, and 1 mile — anchored to your home location let you analyze exactly what's passing that close, alongside the Class D boundary. Data is always fresh — no cached snapshots. Tap any contact to follow its track across the airspace.

Tap a contact for its track
STOP 05 / 09

The core metric: low minutes

We count time, not planes. Every minute with a qualifying aircraft overhead is one "low minute," rolled up by hour and day. The Lowest Flights page ranks every aircraft by its minimum recorded AGL altitude — with exact coordinates and a map link for each entry.

Minutes, not just counts
MIN AGL: 312 FT
STOP 06 / 09

Replay any flight, minute by minute

Pick a date and select a specific flight from the table — it collapses to give the map full space. The track is altitude-coloured (red = low, blue = high). The scrubber locks to that flight's time window with ▶/⏹ markers; arriving from the Lowest page jumps straight to the aircraft's lowest-altitude moment.

Red → blue = altitude climb
STOP 07 / 09

How low does it actually get?

The AGL Heatmap divides the area into a fine grid and colour-codes each cell by its minimum recorded altitude above ground level — red for near-terrain passes, green for comfortable clearance. Contour lines derived from USGS terrain data overlay the map underneath.

Red = near terrain · Green = clear
LOW AGLHIGH AGL
STOP 08 / 09

Who's flying what

The Aircraft by Type page profiles every type that has entered the envelope — manufacturer breakdown, year-of-manufacture buckets drawn from the FAA registry (~360 k US aircraft), percentage shares, and a sound characteristics panel to connect what you hear to what you see on radar.

FAA registry · ~360 k aircraft
CESSNA34%PIPER22%BEECH13%OTHER31%YEAR BUILT →
STOP 09 / 09

From data to civic action

The Officials page maps every Dutchess County elected representative — Congress, NYS Senate, Assembly, and County Legislature — filtered to your registered address. An Airport Officials tab lists KPOU and FAA contacts directly, with impact across the entire KPOU Class D airspace; elected officials instead see the numbers scoped to just their own district. Registered users can submit feedback — feature requests or bug reports — from the avatar menu.

→ Open the live dashboard
1 · 312 low minutes2 · 208 low minutes
How the data flows

From a passing signal
to a number you can read.

No radar dish, no special access. Aircraft announce themselves; a small ground station listens; the rest is bookkeeping.

01 · CAPTURE

1090 MHz antenna

A rooftop antenna and software-defined receiver pick up ADS-B broadcasts from aircraft up to ~150 mi out.

02 · DECODE

ADS-B Receiver

The receiver decodes each message into position, altitude, speed and callsign, several times per second.

03 · AGGREGATE

Time-series store

Qualifying contacts are filtered to the envelope and rolled up into low-altitude minutes per hour and day.

04 · SHOW

hvratracker.com

A live map, flight replay, AGL heatmap, aircraft profiles, and an elected-officials directory — all open data, refreshed continuously.

See what's overhead
right now.

Live map, flight replay, AGL heatmap, aircraft fleet profiles, and a directory of your elected officials — all built on the same open ADS-B feed.